IBIS Breast Cancer Risk Evaluation Tool
  • Description
  • Software Downloads
  • Documentation
  • Screenshots & Examples
  • Software Change Log
  • FAQs
NEW! v8 [ZIP]

IBIS Risk Evaluator

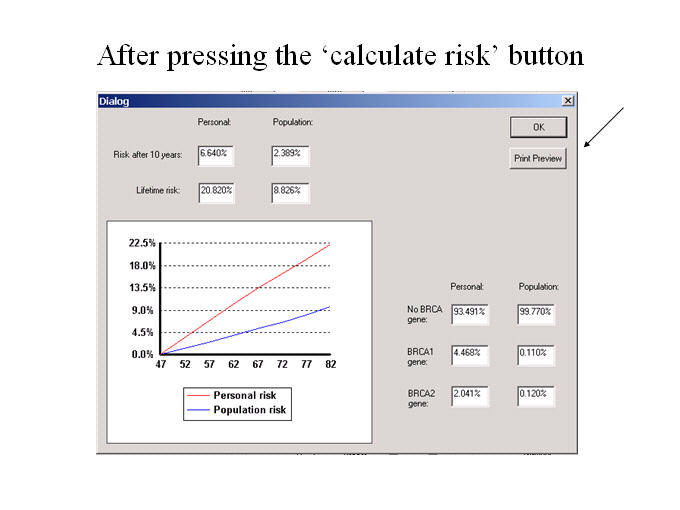
Description of breast cancer risk program

The program assumes that there is a gene predisposing to breast cancer in addition to the BRCA1/2 genes. The woman's family history is used to calculate the likelihood of her carrying an adverse gene, which in turn affects her likelihood of developing breast cancer. The risks of developing breast cancer for the general population were taken from data on the first breast cancer diagnosis (ICD-10 code C50) in Thames Cancer Registry area (UK) between 2005-2009. The risk from family history (caused by the adverse genes) is modelled to fit the results in "Familial Breast and Ovarian Cancer: A Swedish Population-based Register Study, Anderson H et al., American Journal of Epidemiology 2000, 152: 1154-1163".

The risk from other classical factors including age at first child and benign disease are combined with familial risk.

The latest version of the model (v8) incorporates mammographic density.


Contact Details

Prof. Jack Cuzick
Centre for Cancer Prevention,
Wolfson Institute of Preventive Medicine,
Charterhouse Square,
London
EC1M 6BQ

email:

Software

The current version of the software is v8. Versions 7 and 6 are obsolete but are available to download because they have been used in earlier research studies. Changes between versions are described in the change log. Please send any reports of bugs to

This tool is provided for research purposes only and no responsibility is accepted for clinical decisions arising from its use. Commercial use requires a license, for further information please email

Current version

v8 (v8.0b latest release, September 2017)  
Windows download -- IBIS_RiskEvaluator_v8b.zip
A Windows batch command-line program is also available, for users who wish to processing several risk evaluations at the same time without a graphical user interface. To access it please email a request to stating intended use.

Obsolete versions

v7 (version 7.02 released June 2013)  
Windows download -- IBIS_RiskEvaluator_v7.zip
v6 (released August 2004)  
Windows download -- IBIS Risk Evaluator.zip
Example.txt


Overview of evaluator

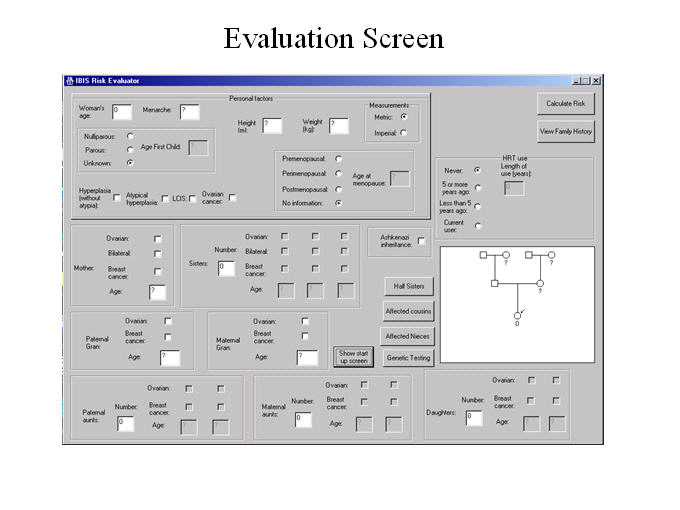
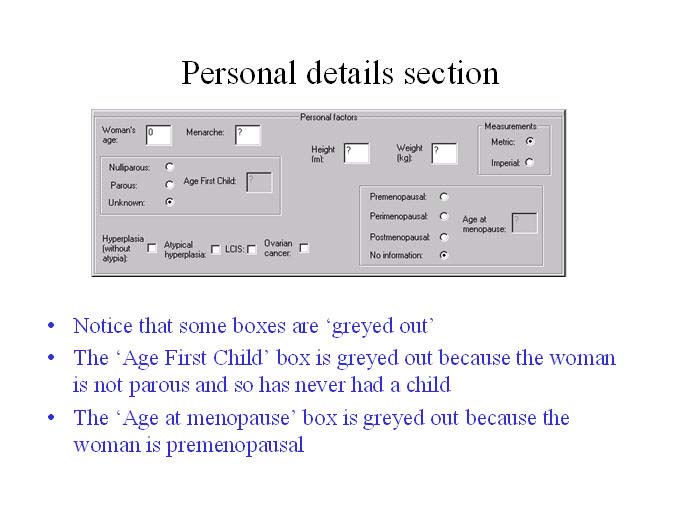
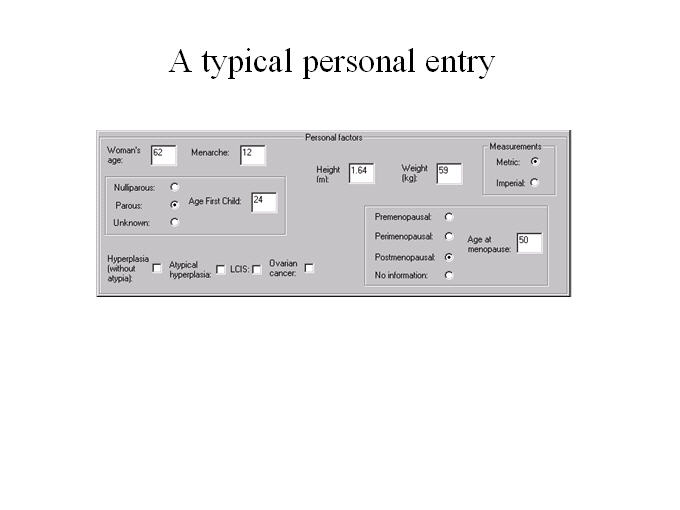
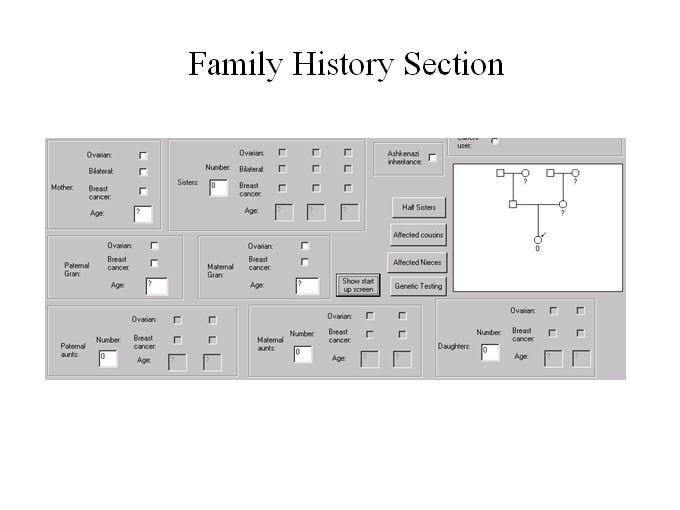
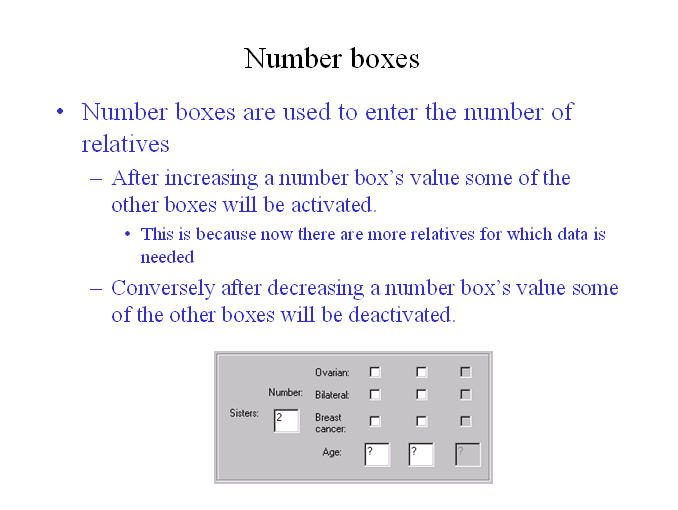
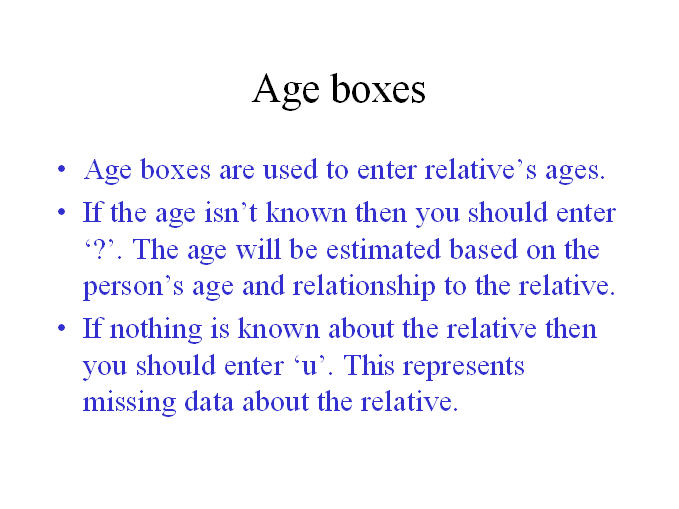
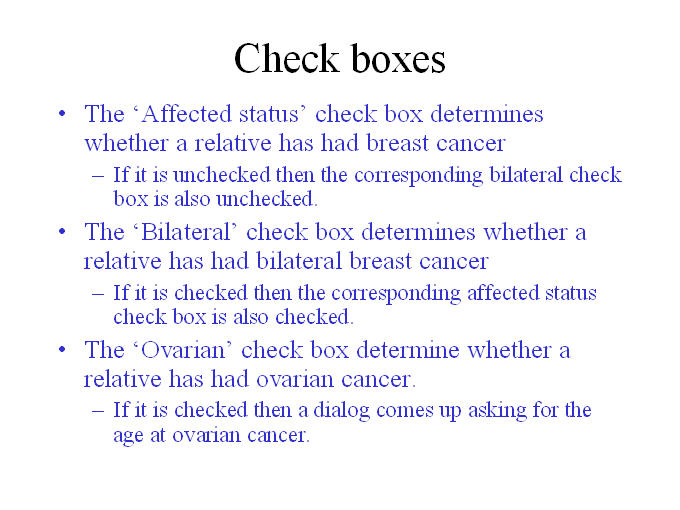
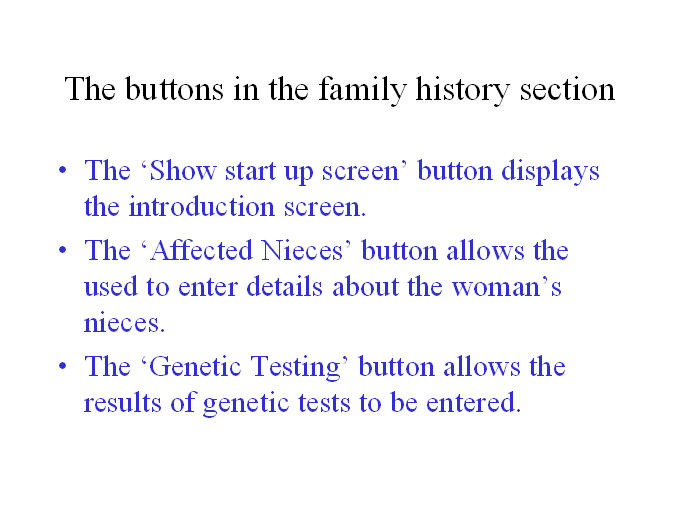
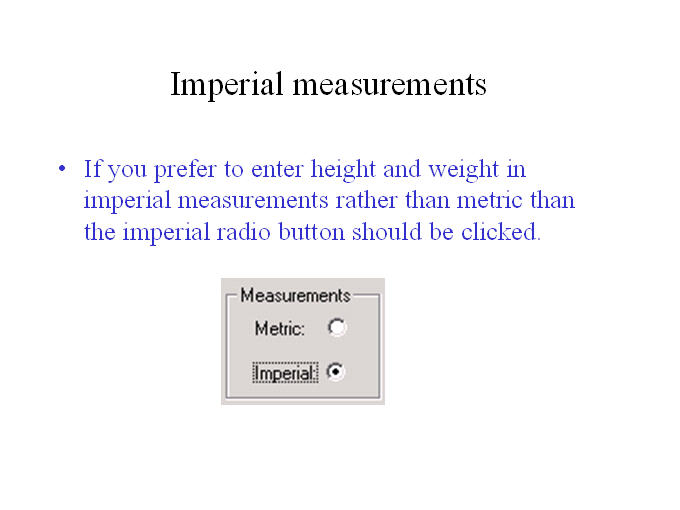
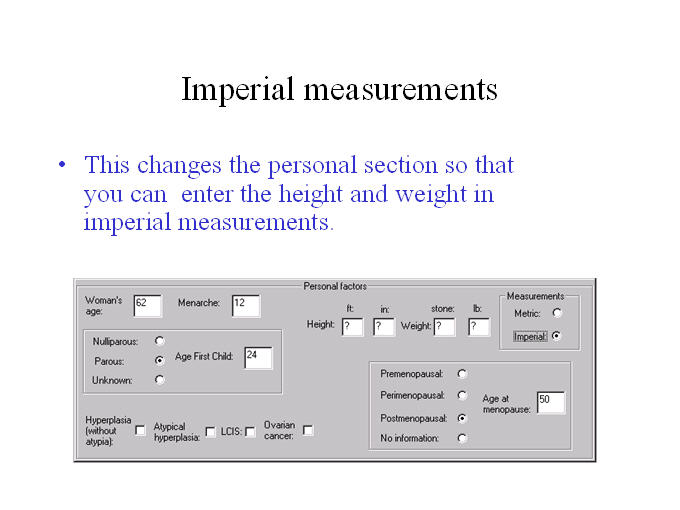
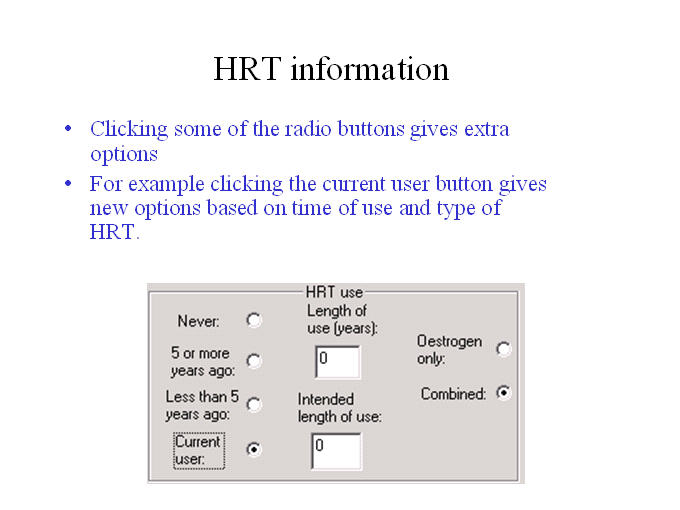
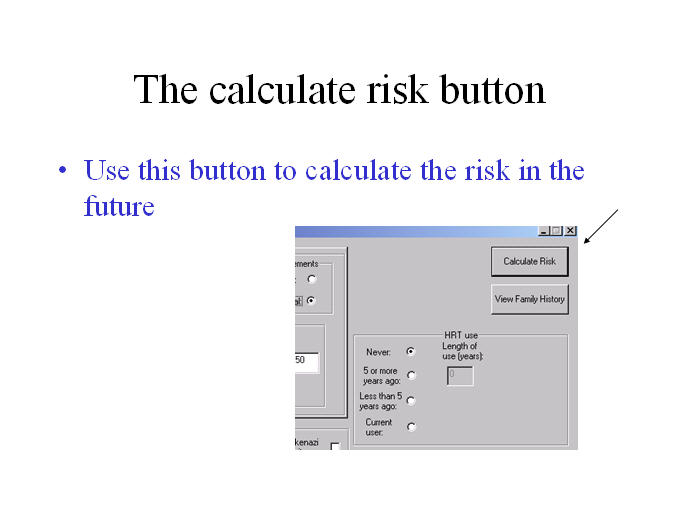
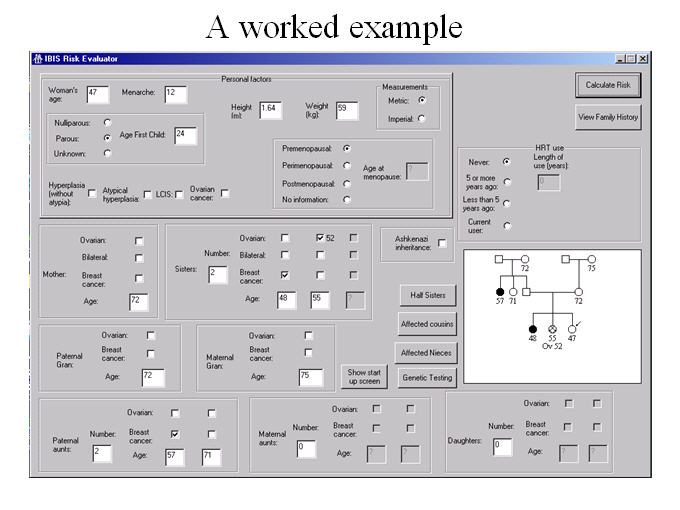
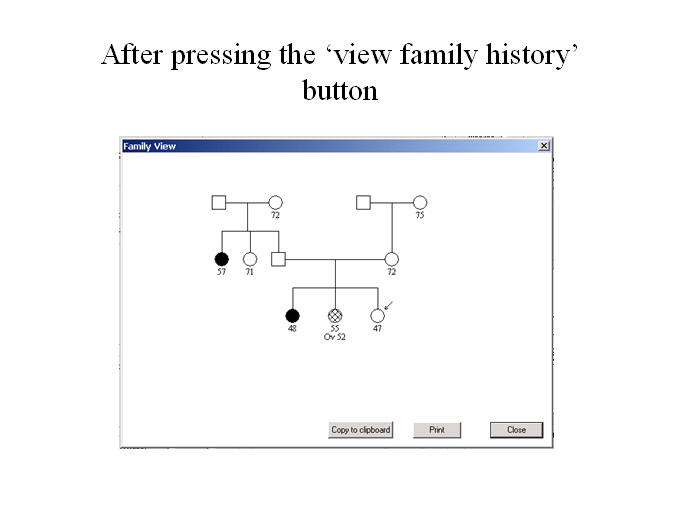
The program begins by opening the introduction screen. If you want to go directly to the evaluation screen the next time the program is run then you should tick the ‘Start from evaluation screen’ box.

The top part of the evaluation screen deals with personal information about the woman - her age at menarche, parity etc. The bottom part of the screen deals with her family history. The picture in the form gives the family history in the form of a pedigree diagram.

When entering details about a family member, if she developed breast cancer then the age at breast cancer should be put in the relevant age box, otherwise her current age should be used (or the age at which she died if applicable). If she developed ovarian cancer then a box is activated which asks for details at which age it occurred. Similarly if she developed bilateral breast cancer then a box is activated which asks for the age at which breast cancer developed in the second breast. If age is not known then ‘?’ should be entered in the age box. If it is not known whether a relative developed breast cancer then ‘u’ should be typed in the age box to represent no information. If the woman has an affected niece in the family then the affected niece button should be pressed to enter the details.

The effects of weight were only assumed to affect risk once the menopause is reached. If the height is not known then the BMI cannot be calculated and so weight is ignored. The risk from height is also assumed to be independent from the BMI. If you prefer to use imperial measurements for height and weight then the imperial radio button should be clicked.

Typing '?' represents missing data. If nothing is known about parity then the unknown radio button should be pressed. Similarly if nothing is known about the woman’s menopause the no information radio button should be pressed. If the woman has had atypical hyperplasia, LCIS or some other benign breast disease then the appropriate box should be ticked.

If genetic testing has taken place within the family, then the ‘Genetic Testing’ button can be pressed to give a form on which to enter the results. Finally to get back to the introduction screen the ‘Show start up screen’ button should be pressed.

The tools menu gives you options to choose the number of years to risk, whether to allow for competing mortality risks, and to choose population rates (UK, Sweden or Slovenia).

NEW v8! Information on mammographic density is given in the model under the Help menu. If entering mammographic density, then it is also very important to enter height and weight to obtain the most accurate risk assessment for an individual woman.

More documentation may be downloaded from the following links.

Original article on model (Stat Med)
Description of changes to v8 (DI Europe)
Amir et al.pdf
Program details
Risk program details
Risk program input file format (v6-8)


For further information on mammographic density please follow the following links.

  • areyoudense.org (general information).
  • densebreast-info.org (general information).
  • Volpara® Volumetric Density (commercial software to calculate mammographic density that may be entered into v8)
  • BI-RADS® ATLAS* Density Breast Composition Measure (radiological interpretation of mammographic density that may be entered into v8).
  • Visual Assessment Score (radiological score of mammographic density that may be entered into v8)
    • Brentnall, A. R., Harkness, E. F., Astley, S. M., Donnelly, L. S., Stavrinos, P., Sampson, S., Fox, L., Sergeant, J. C., Harvie, M. N., Wilson, M., Beetles, U., Gadde, S., Lim, Y., Jain, A., Bundred, S., Barr, N., Reece, V., Howell, A., Cuzick, J., Evans, D. G., Dec. 2015. Mammographic density adds accuracy to both the Tyrer-Cuzick and gail breast cancer risk models in a prospective UK screening cohort. Breast Cancer Research 17 (1), 147+. URL
    • Sergeant, J. C., Wilson, M., Barr, N., Beetles, U., Boggis, C., Bundred, S., Bydder, M., Gadde, S., Hurley, E., Jain, A., Lim, Y., Lord, L., Reece, V., Evans, D. G., Howell, A., Astley, S. M., 2013. PB.17: Inter-observer agreement in visual analogue scale assessment of percentage breast density. Breast Cancer Research 15 (Suppl 1), P17+. URL
    • Sperrin, M., Bardwell, L., Sergeant, J. C., Astley, S., Buchan, I., Nov. 2013. Correcting for rater bias in scores on a continuous scale, with application to breast density. Statistics in medicine 32 (26), 4666-4678. URL
    • Harkness, E. F., Sergeant, J. C., Wilson, M., Beetles, U., Gadde, S., Lim, Y. Y., Howell, A., Evans, D. G., Astley, S. M., 2016. Should We Adjust Visually Assessed Mammographic Density for Observer Variability? Springer International Publishing, Cham, pp. 540-547.URL

*BI-RADS® ATLAS is a registered trademark of American College of Radiology. All rights reserved. The developer of this product is independently owned and operated, and is not an affiliate of the American College of Radiology. The American College of Radiology is not responsible for the contents or operation of this product or its associated software, and expressly disclaims any and all warranties and liabilities, expressed or implied, in connection therewith.

Please click on an image below from an enlarged view

All images can be found in a powerpoint presentation that is available for download


Summary of version changes

Changes to version 8

Main changes

  • Mammographic density added as a risk factor
    • Mammographic density appears as white (radiopaque) areas on a mammogram. Dense breasts have more fibroglandular tissue and less fat than non-dense breasts.
    • Three measures of mammographic density may be used in v8. These are
      • Volpara® Volumetric Density
        • Volpara® Volumetric Density is a fully-automated method to estimate percentage volumetric density that requires commercial software and digital mammography DICOM files ("FOR PROCESSING" type)
      • Visual Assessment Scale (VAS) Density
        • Assessed visually using a standard visual analogue scale from 0% to 100%. Requires training.
      • BI-RADS® ATLAS* Density Breast Composition Measures
        • The categories are defined:
          • a. The breasts are almost entirely fatty
          • b. There are scattered areas of fibroglandular density
          • c. The breasts are hetereogeneously dense, which may obscure small masses
          • d. The breasts are extremly dense, which lowers the sensitivity of mammography
        • *BI-RADS® ATLAS is a registered trademark of American College of Radiology. All rights reserved.
  • Change to atypical hyperplasia model for women with substantial family history
    • Risk given is based on the maximum 10y risk from atypical hyperplasia, or other factors than atypical hyperplasia.
  • Definition of unknown benign disease updated
    • `Unknown' benign disease now refers to when a biopsy has been taken, but the benign disease classification is unknown
  • Option for polygenic SNP score added
    • This treats a polygenic relative risk score (relative to the population) as independent of other factors.
    • It requires the user to enter a relative risk associated with the SNP score.

Minor changes

  • Addition of Slovenian baseline rates
  • HRT intended use now defaults to two years
  • Bugs with the GUI corrected
    • Corrected error with BRCA1/2 estimates displayed when atypical hyperplasia selected
    • Added ashkenazi info to print out
    • Corrected bugs with family tree, drawing brother and affected nieces previously
  • Changes to GUI
    • Saves last used risk length, competing mortality option and country so that the user does not have to keep changing them if e.g. always using Swedish rates.
    • Density, SNP risk and country added to print out; age added to x-axis label
    • Reorganised layout of form to include density
    • Updated input file format to include density and SNPs (MS Word .doc description).

Bug fixes

  • v8.0b (13-Sep-2017): Fixed problem with HRT calculation.

Beta version changes

  • beta6.rc2 (17-Jan-2017): Updated density box on form. Now defaults to the last density method chosen after selecting 'Add'.

Changes to version 7

Main changes

  • The way risk is calculated for women with atypical hyperplasia and LCIS (no other risk factors used in calculation)
    • Following Boughey, J. C., L. C. Hartmann, S. S. Anderson, A. C. Degnim, R. A. Vierkant, C. A. Reynolds, M. H. Frost, and V. S. Pankratz (2010). Evaluation of the Tyrer-Cuzick (international breast cancer intervention study) model for breast cancer risk prediction in women with atypical hyperplasia. Journal of Clinical Oncology 28 (22), 3591-3596.
  • Updated and smoothed rates of invasive breast cancer (ICD-10 code C50)
    • UK: smoothed first breast cancer rates from Thames cancer registry, 2005-2009
    • Sweden: smoothed first breast cancer rates, 2006-2010
  • Updates to the genetic model BRCA assumptions
    • Following estimates from Antoniou, A. C., A. P. Cunningham, J. Peto, D. G. Evans, F. Lalloo, S. A. Narod, H. A. Risch, J. E. Eyfjord, J. L. Hopper, M. C. Southey, H. Olsson, O. Johannsson, A. Borg, B. Passini, P. Radice, S. Manoukian, D. M. Eccles, N. Tang, E. Olah, H. Anton-Culver, E. Warner, J. Lubinski, J. Gronwald, B. Gorski, L. Tryggvadottir, K. Syrjakoski, O. P. Kallioniemi, H. Eerola, H. Nevanlinna, P. D. P. Pharoah, and D. F. Easton (2008). The BOADICEA model of genetic susceptibility to breast and ovarian cancers: updates and extensions. British Journal of Cancer 98 (8), 1457-1466.
  • Updated hormone replacement therapy component
  • Added competing risks projection, to give risk allowing for death from other causes than breast cancer
    • UK: smoothed rates from 2008
    • Sweden: smoothed rates from 2006-2010
    • Competing risks methodology following Gail, M. H., L. A. Brinton, D. P. Byar, D. K. Corle, S. B. Green, C. Schairer, and J. J. Mulvihill (1989). Projecting individualized probabilities of developing breast cancer for white females who are being examined annually. Journal of the National Cancer Institute 81 (24), 1879-1886.

Some more minor changes have also been made.

  • Allowed father or brother to have breast cancer. They are treated the same was as an affected woman aged 35. The output file has been ammended to allow this, but the program will still read in version 6 files.
  • Standardised lifetime risk: charts and predictions to 85
  • Allow user to enter llbs, without giving stones
  • Allow user to specify number of years to risk in results
  • Cosmetic changes, including that the results graph runs to 85 and is plotted yearly to make it smoother. The woman's ID and date are included on the print out
  • Added a Tools menu for competing risks, number of years to risk, and country population rates.

Version 7 bug fixes and updates
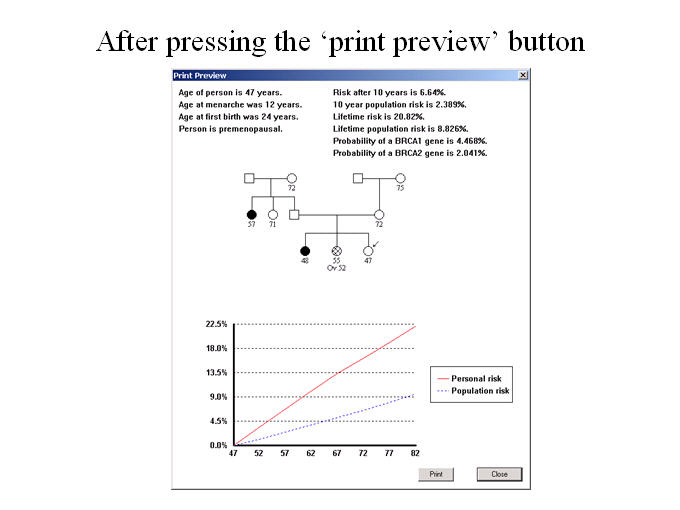
  • v7.01: Fixed ovarian cancer older than 80 evaluation bug.
  • v7.02: Cosmetic changes to form, including making the competing mortality option easier to access.

Changes to version 6

The program now allows you to save patients’ details. Also more information about the woman is given in the print preview screen.

A number of other options are available in the toolbar. These are

Add – Add a patient to the file.
Del – Remove a patient from the file.
Risk – Create a file giving risks for the patient in 10 years time.
Sort – Sort the patients in alphabetical order
Find – Find a patient (from the id code)

Format of text file used for saving patients’ details (only needs to be known if using the program for batch input)

Version number (in this case “v6”)

number of patients

For each patient

patient_id    age    menarche    parous (2 not known)   age_at_first_child
menopause_status (3 not known)   menopause_age    height (in m)    weight
(in kg)
hyperplasia(without atypia)    atypical_hyperplasia    LCIS
ovarian_status    age_at_ovarian_cancer    ashkenazi_inheritance
hrt_use    hrt_type    hrt_length    intended_use_length    hrt_last_use
genetic_test    father_genetic_test
mother_affected_status    mother_bilateral_status    mother_ovarian_status
mother_age    mother_bilateral_age    mother_ovarian_age
mother_genetic_test_result
no_of_sisters    for each sister defined (same seven variables as defined
for mother (affected_status...genetic_test_result))
paternal_gran variables (7 variables as before)
maternal_gran variables
no_of_paternal_aunts    variables for each maternal aunt
no_of_maternal_aunts    variables for each paternal aunt
no_of_daughters    variables for each daughter
no_of_nieces (= number of sisters + number of brothers with daughters)
for each sister: no_of_daughters    variables for each daughter
no_of_paternal_half_sisters    variables for each half_sister
no_of  maternal_half_sisters    variables for each half sister
no_of_paternal_aunts    for each paternal aunt: number of daughters
variables for each daughter
no_of_maternal_aunts    for each maternal aunt number of daughters
variables for each daughter
no_of_paternal_brothers_with_daughters    for each paternal brother: number
of daughters    variables for each daughter
no_of_maternal_brothers_with_daughters    for each maternal brother: number
of daughters    variables for each daughter

For missing data -99 should be generally be used.

Special cases

The patient_id is a string variable containing the code for the patient
(underscores should be used instead of spaces if necessary).
parous - 0 nulliparous, 1 parous, 2 status not known.
menopausal_status - 0 premenopausal, 1 perimenopausal, 2 postmenopausal, 3
status not known
hrt_use -  0 never,  1  use >5 years ago, 2  use <5 years ago, 3  current
user
hrt_type -  0 oestrogen only,  1 combined (relevant for hrt users, but 1 by
default)
hrt_length - how long someone has been using hrt in the past (relevant for
hrt users, 0 by default)
intended use length - how long someone intends using hrt in the future
(relevant for current users, 0 by default)

For each relative

affected status - 0 no breast cancer, 1 breast cancer
bilateral_status - 0 no bilateral breast cancer, 1 bilateral breast cancer
ovarian_status - 0 no ovarian cancer, 1 ovarian cancer
age - age of relative
bilateral_age - age at bilateral cancer (relevant if woman had bilateral
breast cancer, -99 default)
ovarian_age - age at ovarian cancer (relevant if woman had ovarian
cancer, -99 default)
genetic test - 0  no test,  1  no BRCA gene found,   2  BRCA1 gene found,  3
BRCA2 gene found

Changes to version 5.1 

Added “Copy to Clipboard” option for print preview screen so that user can paste results into Word or PowerPoint.

Changes to version 5

  • Added the buttons “Affected cousins” and “Half sisters”. These activate dialog boxes, which ask for information about cousins and half sisters respectively.
  • Added a check box for Ashkenazi inheritance to be ticked for someone from an Ashkenazi Jewish family.


FAQs

  1. v8 and v7 give higher lifetime risks than v6. Why?

    Figure 1. UK Breast cancer incidence (C50, invasive) in 1994 and 2008-2010 (source: Cancer Research UK).
    Table 1 Breast cancer rates (per year, 100K) used in the models.
    Age group v6 v7/8 (UK) v7/8 (Sweden)
    20 – 24 1.2 1.3 1.0
    25 – 29 8.0 9.1 7.0
    30 – 34 26.6 24.2 24.6
    35 – 39 60.7 57.5 50.2
    40 – 44 112.6 115.6 108.4
    45 – 49 180.3 182.3 188.5
    50 – 54 244.2 250.3 217.9
    55 – 59 256.5 266.2 248.9
    60 – 64 277.1 318.7 324.8
    65 – 69 244.3 378.5 363.4
    70 – 74 283.1 296.4 336.9
    75 – 79 328.7 331.9 274.3
    80 – 84 357.2 369.7 307.6

    There are two main reasons. Firstly, lifetime risk from v7+ runs to age 85; in v6 it was until age 80. Secondly, the population rates used have been updated to be more applicable for risk assessment of women today. Figure 1 shows how incidence has risen between 1994 and 2008-2010; Table 1 summarises the difference between the rates used by versions 6-8. The main difference is that in 1994 women in the UK were not screened beyond age 64 (V6). The increase in rates beyond 60 mostly reflects more screening in these age groups between 2005-2010 than in 1994. Differences between UK (Thames Registry first breast cancer rates 2005-2009) and Sweden (Statistics Sweden first breast cancer rates 2006-2010) might also be explained by temporal differences in screening regimens, including that Sweden has screened later ages for longer than the UK.

  2. v8 identifies more women at high risk than v7. Why?

    The main reason is that it includes more risk factors (density and SNPs). Both of these with increase the number of women accurately identified to be at high risk. If they are incorporated into the risk assessment then more women will be at high (and low) risk than when they are not used.

  3. Are the rates used appropriate for the USA, or other countries?

    The model uses a `period' epidemiological approach, and is calibrated to first breast cancer diagnosis rather than incidence. First breast cancer rates are not usually published. However, one way to assess whether the model is broadly in alignment is to use the SEER age-standardised incidence. Over the period 2005-2009 in the Thames cancer registry this was 119.5, and may be directly compared with the numbers published by the NCI on their website (last accessed 14th June 2013). For example, the SEER age-standardised rate between 2005-2009 in Georgia was 119.7. For comparison, the SEER age-standardised UK first cancer rate that is used in V7 is 114.7.

  4. Why is competing mortality not default?

    Lifetime risk including the competing mortality option gives an assessment that allows from death from other causes than breast cancer. It is not used by default for consistency: cumulative incidence is usually presented conditional on no intercurrent mortality. However, it is easy to toggle back and forth on the form by using the checkbox next to the risk assessment button.

  5. What are the benign breast biopsy categories?

    Table 2 Breast biopsy risk classification to use in model. Adapted from Page and Dupont (1993), http://dx.doi.org/10.1007/bf00666428.
    No benign disease
    (includes no proliferative disease)
    Adenosis
    Apocrine change
    Duct ectasia
    Mild epithelial hyperplasia of usual type
    Hyperplasia (not atypia)
    (Proliferative disease without atypia)
    Hyperplasia of usual type, moderate or florid
    Papilloma (probably)
    Sclerosing adenosis
    Atypical hyperplasia
    Atypical ductal hyperplasia
    Atypical lobular hyperplasia
    LCIS
    Lobular carcinoma in situ

    The benign disease categorisation shown in Table 2 is based on the classical work from Page and Dupont (1993, link); see also Hartmann et al (2005, link). Fibroadenomas are considered nonproliferative unless they also contain a proliferative lesion. The 'unknown' category is for when the result from a prior biopsy is unknown.

  6. Have there been any publications validating the model for risk evaluation?

    Work is ongoing in a number of studies. Some articles to specifically address this issue include the following.

    • Cuzick, J., Brentnall, A. R., Segal, C., Byers, H., Reuter, C., Detre, S., Lopez-Knowles, E., Sestak, I., Howell, A., Powles, T. J., Newman, W. G., Dowsett, M. To appear 2017. Impact of a panel of 88 single nucleotide polymorphisms on the risk of breast cancer in High-Risk women: Results from two randomized tamoxifen prevention trials. Journal of Clinical Oncology. URL
    • Evans, D. G., Brentnall, A., Byers, H., Harkness, E., Stavrinos, P., Howell, A., risk study Group, F., Newman, W. G., Cuzick, J., Oct. 2016. The impact of a panel of 18 SNPs on breast cancer risk in women attending a UK familial screening clinic: a case–control study. Journal of Medical Genetics. URL
    • Brentnall, A. R., Harkness, E. F., Astley, S. M., Donnelly, L. S., Stavrinos, P., Sampson, S., Fox, L., Sergeant, J. C., Harvie, M. N., Wilson, M., Beetles, U., Gadde, S., Lim, Y., Jain, A., Bundred, S., Barr, N., Reece, V., Howell, A., Cuzick, J., Evans, D. G., Dec. 2015. Mammographic density adds accuracy to both the Tyrer-Cuzick and gail breast cancer risk models in a prospective UK screening cohort. Breast Cancer Research 17 (1), 147+. URL
    • Warwick, J., Birke, H., Stone, J., Warren, R. M. L., Pinney, E., Brentnall, A. R., Duffy, S. W., Howell, A., Cuzick, J., Oct. 2014. Mammographic breast density refines Tyrer-Cuzick estimates of breast cancer risk in high-risk women: findings from the placebo arm of the international breast cancer intervention study i. Breast Cancer Research 16 (5), 451+. URL
    • Quante, A. S., A. S. Whittemore, T. Shriver, K. Strauch, and M. B. Terry (2012). Breast cancer risk assessment across the risk continuum: genetic and nongenetic risk factors contributing to differential model performance. Breast cancer research : BCR 14 (6), R144+.
    • Amir, E., D. G. Evans, A. Shenton, F. Lalloo, A. Moran, C. Boggis, M. Wilson, and A. Howell (2003). Evaluation of breast cancer risk assessment packages in the family history evaluation and screening programme. Journal of medical genetics 40 (11), 807-814.


 ©
Page last updated 17/Sept/2017